Results of project PhotoLED
This page includes all published results of the project, including open-access peer-reviewed scientific papers and conference proceedings papers written about operation of the new LED calibration sources as well as measurement methods developed.
Publishable summary
-
Download the final publishable summary of the project here: Click
PhotoLED Spectral Database
-
This dataset consists of 1495 relative spectral power distributions collected by the partners and collaborators of project PhotoLED.
The spectra of LED products of different types were measured; including AC- and DC-operated bulbs, spots, tubes, street lamps,
LED strips, downlight luminaires, prints and textures by a large number of manufacturers. The measurements of the products were
carried out in various laboratories, including manufacturers of LED products, test laboratories, and National Metrology Institutes
(NMIs). The products included in the study were manufactured in the timespan of 2009–2016. The spectral database was used in the
analysis of the LED illuminants and LED reference spectrum. Repository link for download:
PhotoLED Spectral Database
Scientific papers
- A. Kokka, T. Pulli, A. Ferrero, P. Dekker, A. Thorseth, P. Kliment, A. Klej, T. Gerloff, K. Ludwig, T. Poikonen and E. Ikonen, "Validation of the fisheye camera method for spatial non-uniformity corrections in luminous flux measurements with integrating spheres," Metrologia 56, 045002, 9p (2019).
- A. Ferrero, J. L. Velázquez, A. Pons, and J. Campos, "Index for the evaluation of the general photometric performance of photometers," Opt. Express 26, 18633–18643 (2018).
- A. Kokka, T. Poikonen, P. Blattner, S. Jost, A. Ferrero, T. Pulli, M. Ngo, A. Thorseth, T. Gerloff, P. Dekker, F. Stuker, A. Klej, K. Ludwig, M. Schneider, T. Reiners, and E. Ikonen, "Development of white LED illuminants for colorimetry and recommendation of white LED reference spectrum for photometry," Metrologia 55, 526–534 (2018).
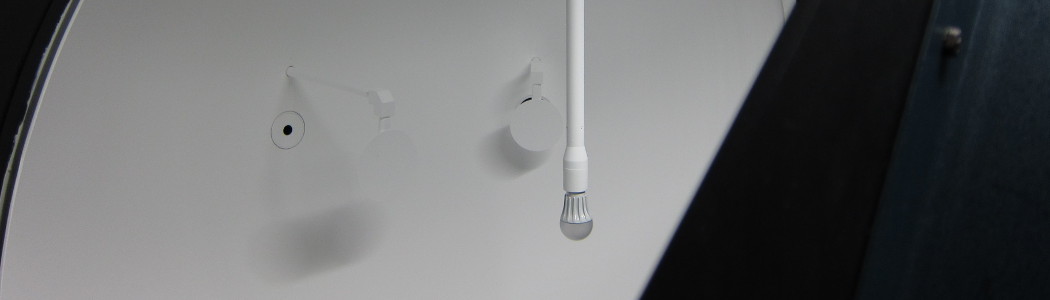
- A. Kokka, T. Pulli, T. Poikonen, J. Askola, and E. Ikonen, "Fisheye camera method for spatial non-uniformity corrections in luminous flux measurements with integrating spheres," Metrologia 54, 577–583 (2017).
In this paper, the fisheye camera method is validated for spatial non-uniformity corrections in luminous flux measurements with integrating spheres. The method was tested in eight integrating spheres with six LED lamps, and the determined angular intensity distributions and spatial non-uniformity correction factors were compared with the results of five goniophotometers.
The article describes a new index for describing the performance of photometers in terms of the spectral mismatch errors. These errors are caused, on the one hand, by the nonideal spectral responsivities of the photometers, and, on the other hand, by the differences between the spectra of the calibration sources and the sources to be measured. The index was found to perform better than the existing quality index for spectral mismatch.
In the article, 8 LED-based illuminants - spectral power distributions describing typical light sources - are proposed for colorimetry. Using one of these illuminants as the calibration spectrum in photometry was found to decrease the spectral mismatch errors by a factor of two on average compared with incandescent-lamp-based calibration source in LED measurements. This LED-based calibration spectrum was also found to decrease spectral mismatch errors when measuring daylight and many types of fluorescent and discharge lamps. Thus, the LED calibration spectrum is a viable alternative to the incandescent-lamp-based Standard Illuminant A. This article was selected as one of the 2018 Highlights of IOP Metrologia, please see: https://iopscience.iop.org/journal/0026-1394/page/Highlights_of_2018
The article describes a method for determining the relative angular intensity distribution of a light source, and thus the spatial correction required in accurate integrating-sphere-based measurements of luminous flux and luminous efficacy, without relying on time- and resource-consuming goniometric measurements. A picture of the inner surface of the integrating sphere is taken with a fisheye camera, and the angular intensity distribution is determined through image processing. The measurement time are reduced from several hours with a goniometer to tens of seconds using the fisheye camera. Spatial nonuniformity corrections obtained with the two methods were compared with each other, and the results showed good agreement.
Conference papers
- June 14-22, 2019, CIE 2019 29th Quadrennial Session (Washington DC, USA): http://washington2019.cie.co.at/welcome-29th-quadrennial-session-cie/. The following papers were presented in the conference by project PhotoLED:
- T. Gerloff et al., 'Luminous intensity comparison based on new standard lamps with LED reference spectrum' (Talk)
- A. Kokka et al., 'Comparison of the fisheye camera method with goniophotometers for measuring relative angular intensity distributions' (Talk)
- T. Donsberg et al., 'Constant-voltage driven temperature stabilized LED flux standard lamp with E27 base' (Talk) - To be published later
- A. Ferrero et al., 'Definition of a spectral mismatch index for spectral power distributions' (Talk)
- A. Thorseth et al., 'Measuring and comparing waveforms of temporal light modulation' (Talk)
- S. Jost et al., 'A colour graphic for real complex scenes: Application to LED illuminants' (Talk)
- P. Dekker et al., 'Mains operated LED based transfer source for luminous flux scale realisation and dissemination' (Poster)
- T. Poikonen et al., 'Future Photometry Based on Solid-State Lighting Products' (Introductory talk + Poster)
-
October 20-28, 2017, CIE Midterm Meeting (Jeju, Korea)
The following papers were presented in the conference. The papers are available for purchase in the CIE webshop. - S. Jost et al., 'Determination of illuminants representing typical white light emitting diode sources' (Talk + Proc. paper)
- T. Poikonen et al., 'Development of new calibration spectra and transfer standard lamps for photometry based on white LEDs' (Talk)
- A. Kokka et al., 'Fisheye camera system for spatial non-uniformity corrections' (Talk + Proc. paper)
- T. Donsberg et al., 'New optical aperture area determination method for LED photometry' (Talk)
- A. Ferrero et al., 'Proposal for a new V(λ) mismatch index' (Talk + Proc. paper)
- A. Ferrero, J. L. Velazquez, A. Pons and J. Campos, "El futuro de la fotometria con iluminación de estado sólido," 6º Congreso Español de Metrologia, Cádiz, Spain, June 6–9, 2017.
Theses
- A. Kokka, "Spatial and Spectral Corrections for Integrating Sphere Photometry and Radiometry," Doctor's thesis, Aalto University, 60 + 40 p (2019).
- Y. Zhu, "Development of Transfer Standards for SSL Measurement," Master's thesis, TU Delft, 94 p (2017).